Analytics
The Analytics section helps teams measure the impact of feature flags and experiments by providing insights into usage, performance, and user behavior.
Metrics Overview
Analytics dashboards display key metrics such as:
-
Feature Adoption – How many users are exposed to a flag or variation
-
Experiment Results – Conversion and engagement across variations
-
System Health – Latency, error rates, and request volumes
-
Custom KPIs – Business-specific metrics tied to feature rollouts
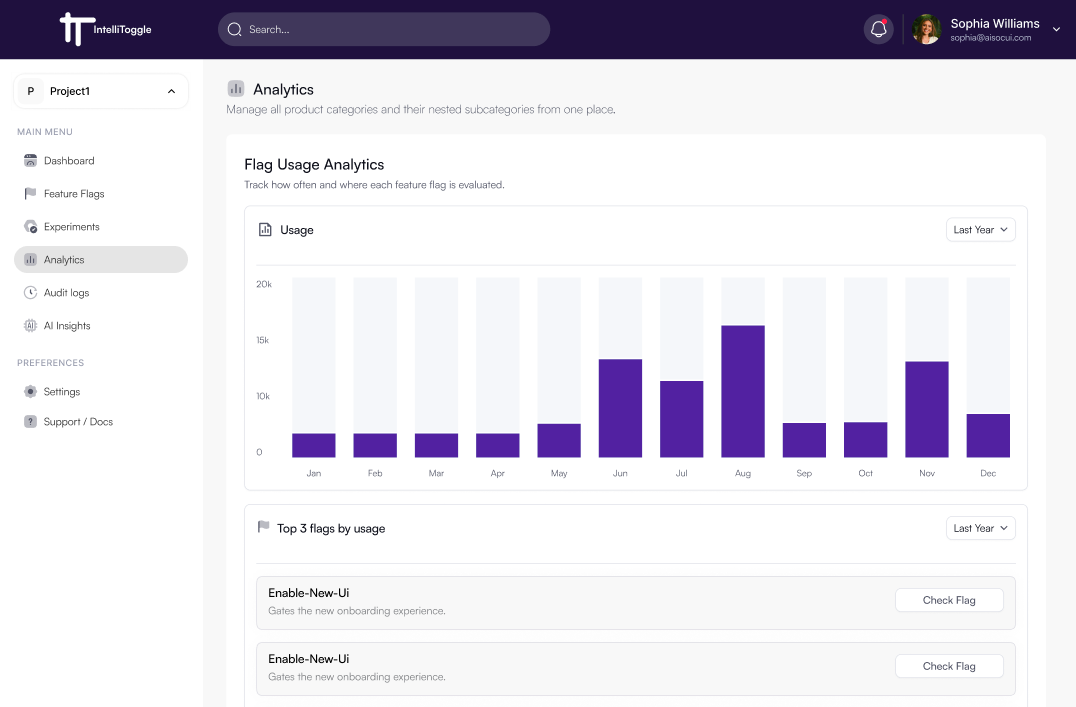
Viewing Analytics
-
Navigate to Analytics from the sidebar.
-
Select a project or environment.
-
View metrics by feature flag, experiment, or user segment.
-
Drill down into specific variations for deeper analysis.
Integrations
Analytics data can be integrated with external tools:
-
Export reports to CSV or JSON
-
Connect to BI platforms for advanced reporting
-
Stream event data to third-party analytics pipelines
Experiment Tracking
Analytics works closely with Experiments. When experiments are running, results are automatically tracked and displayed, making it easier to identify winning variations.